'Molecular Compass' points way to Reduction of Animal Testing
20. August 2024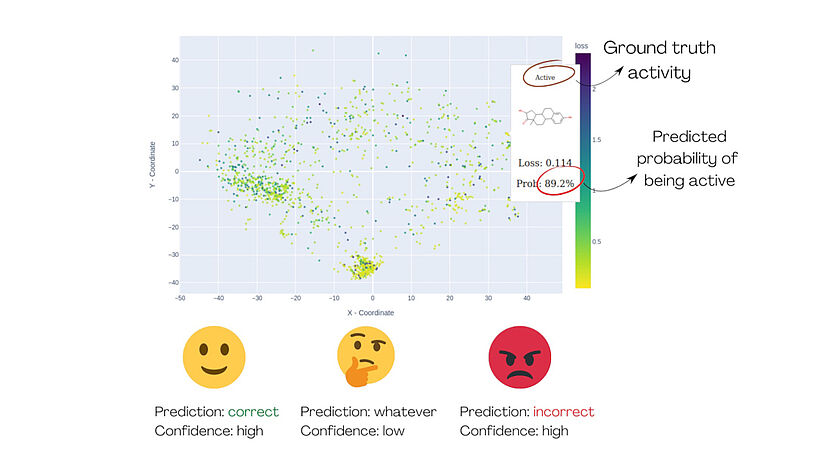
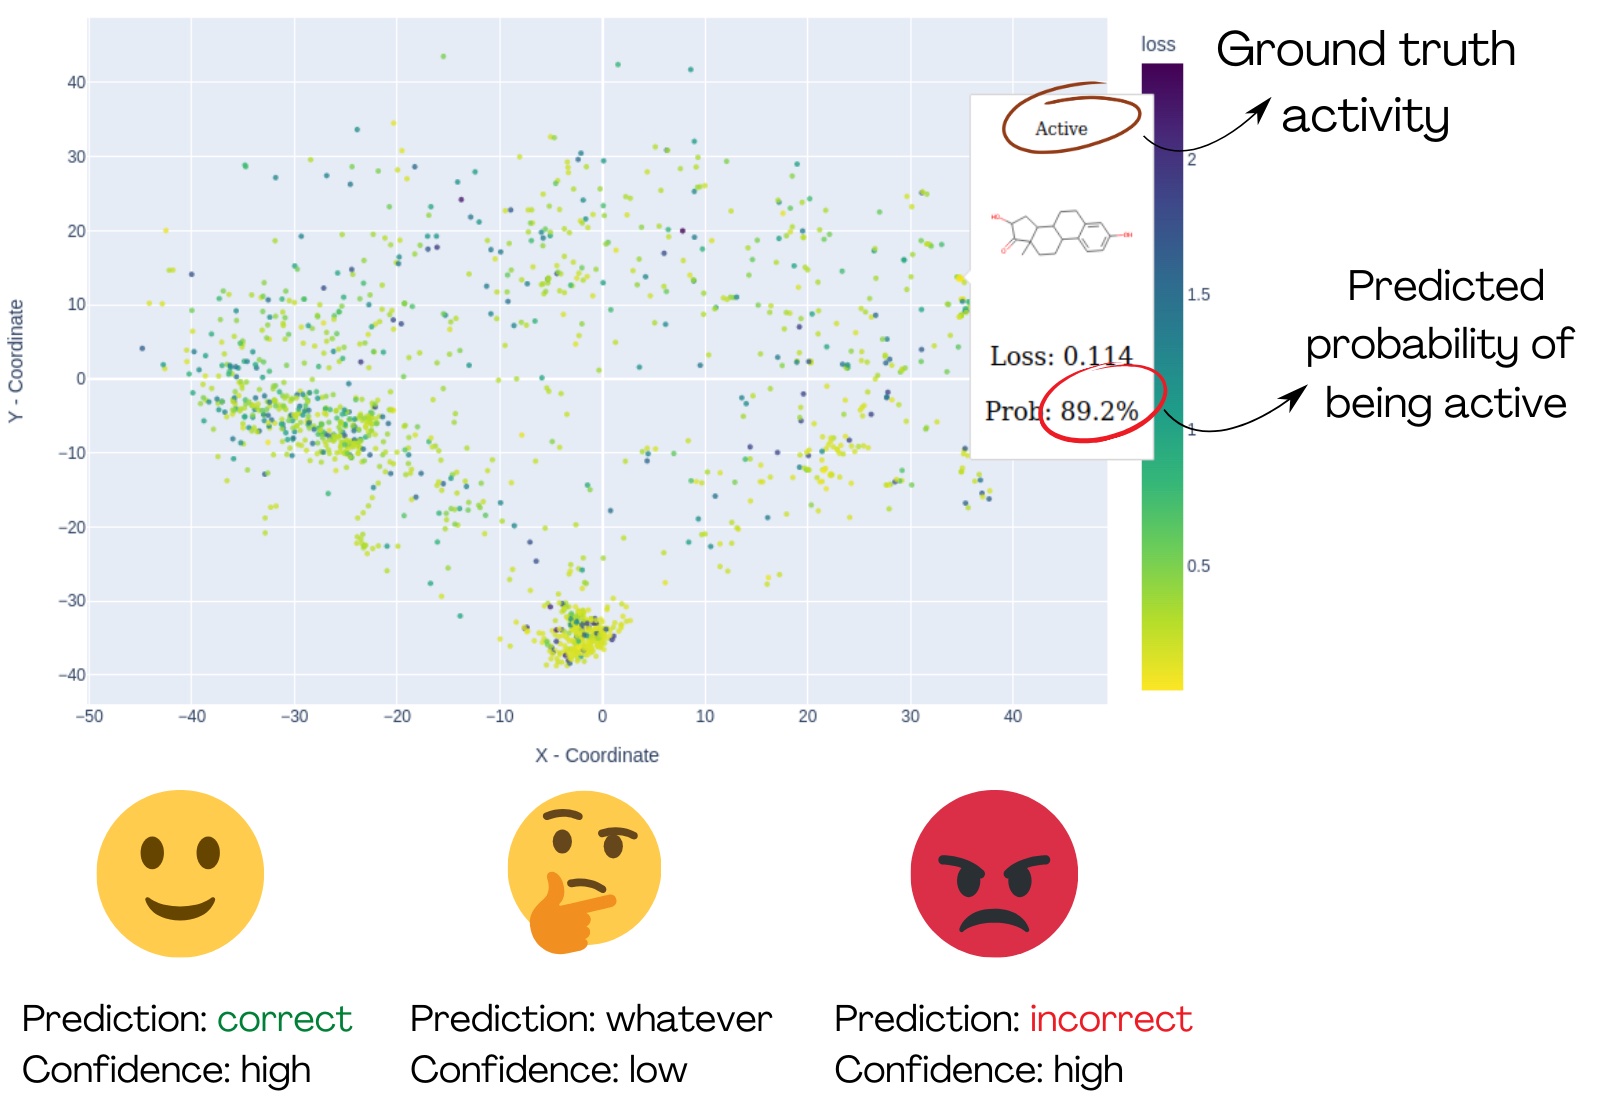
Fig. 1: The demonstration of MolCompass illustrates how a computational toxicologist can identify concerning areas of chemical space. Using our software, the toxicologist can pinpoint regions where the model under investigation incorrectly predicts activity with high confidence. C: Sergey Sosnin
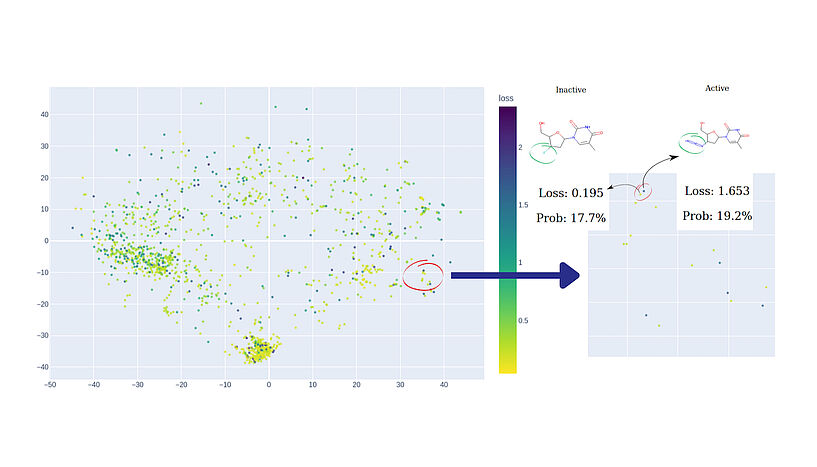
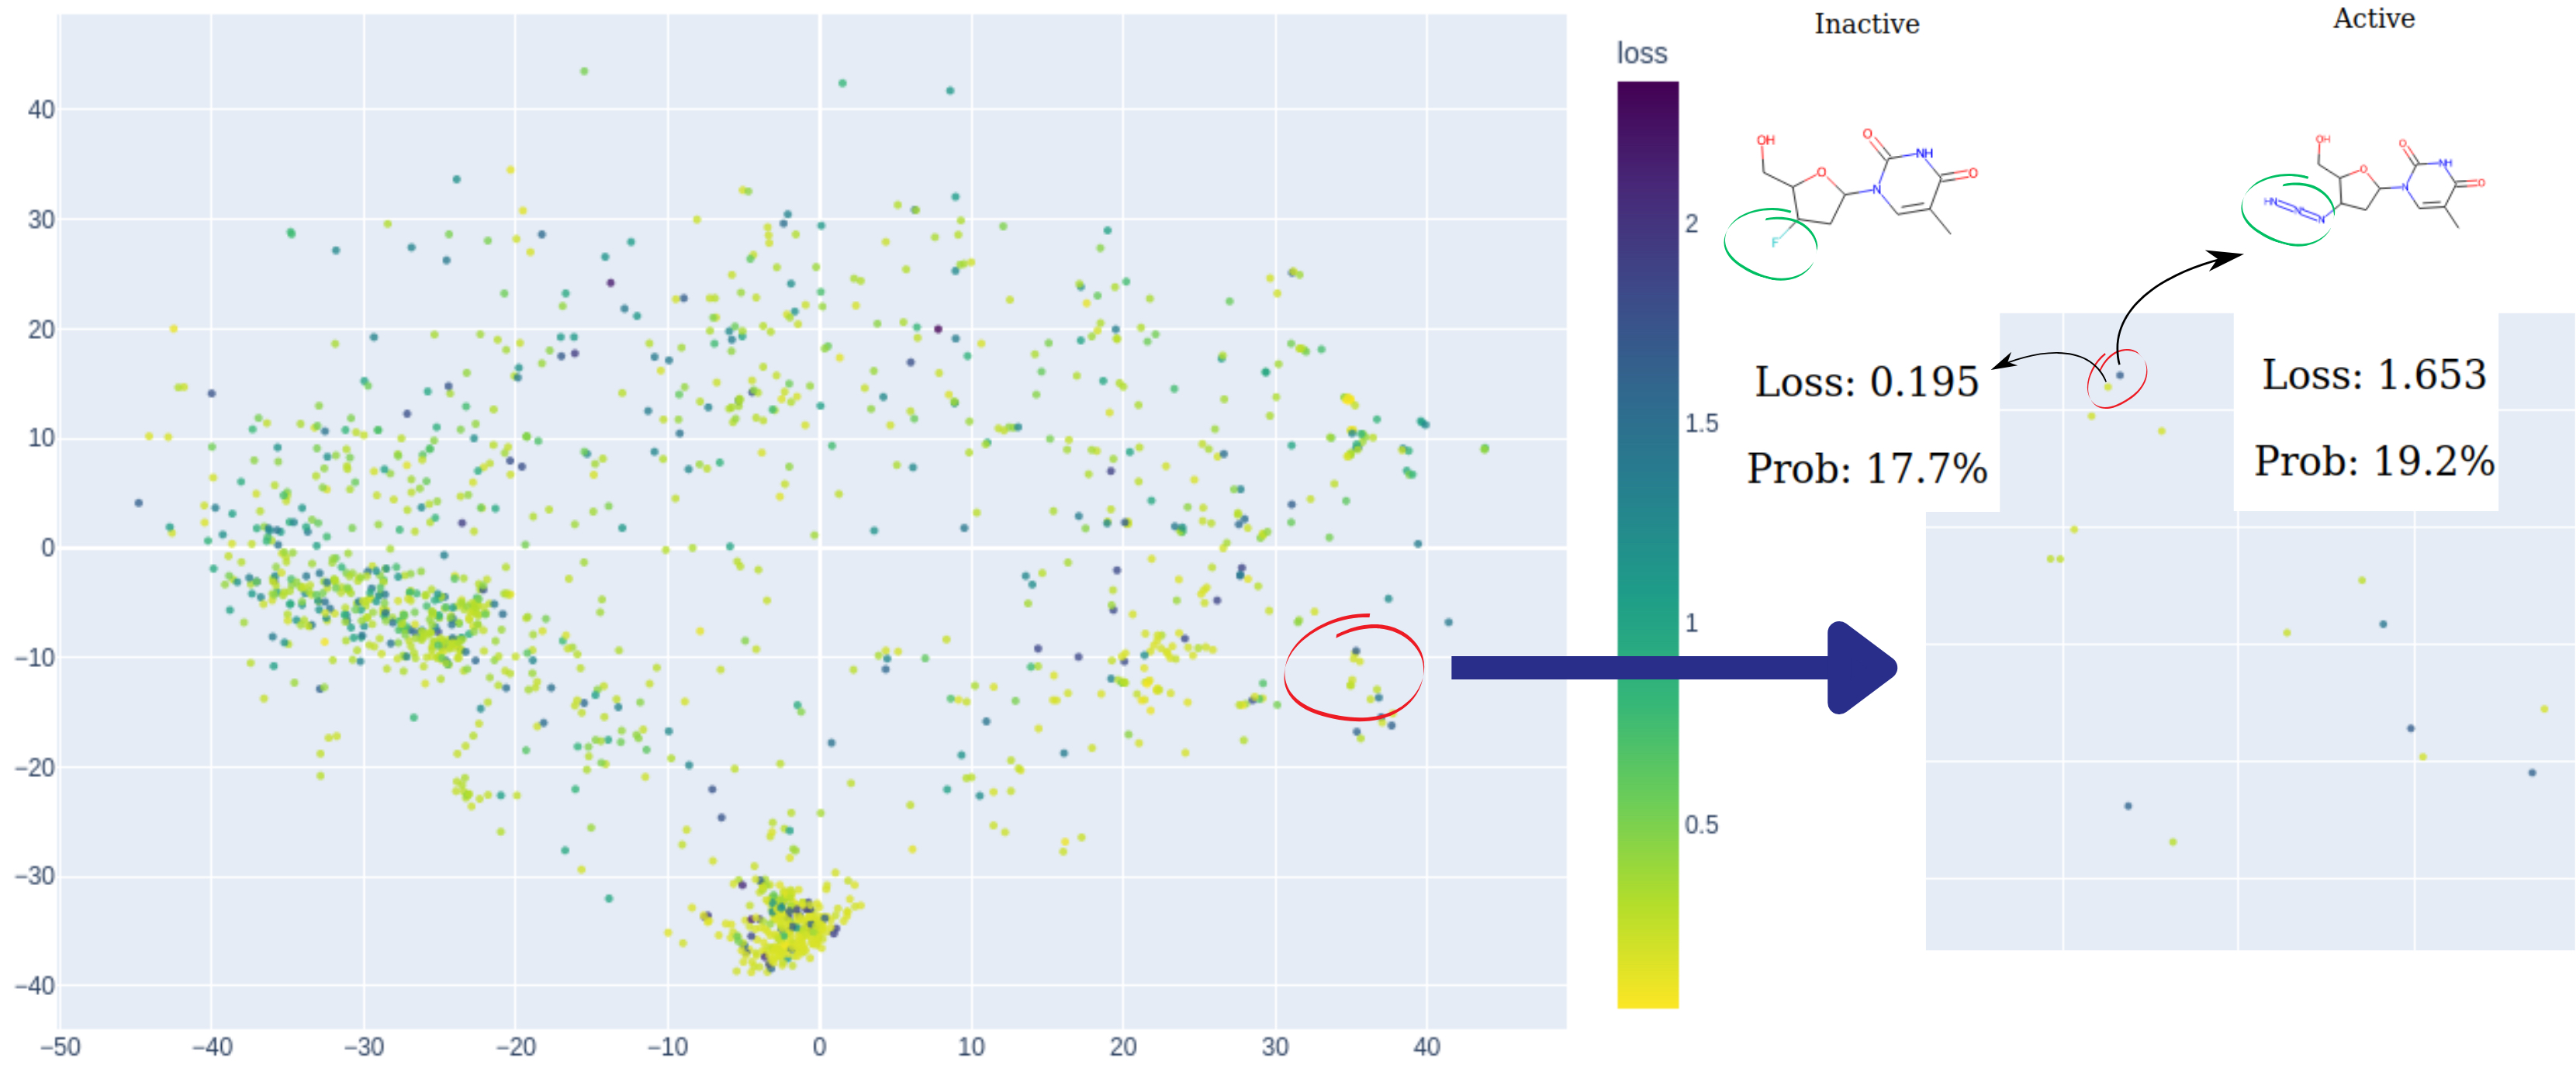
Fig. 2: An illustration of hunting for model cliffs. On the left side of the chemical map, two points lie in close proximity yet display contrasting colors. Further investigation into this peculiar observation uncovers that although these two compounds share a high degree of structural similarity, they exhibit opposite activities, posing a challenge that the model fails to address effectively. The visualised data is: Estrogen Binders dataset. C: Sergey Sosnin
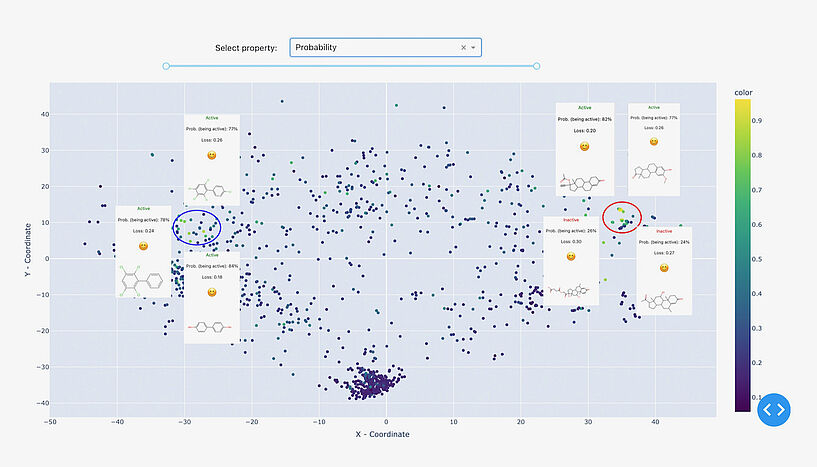
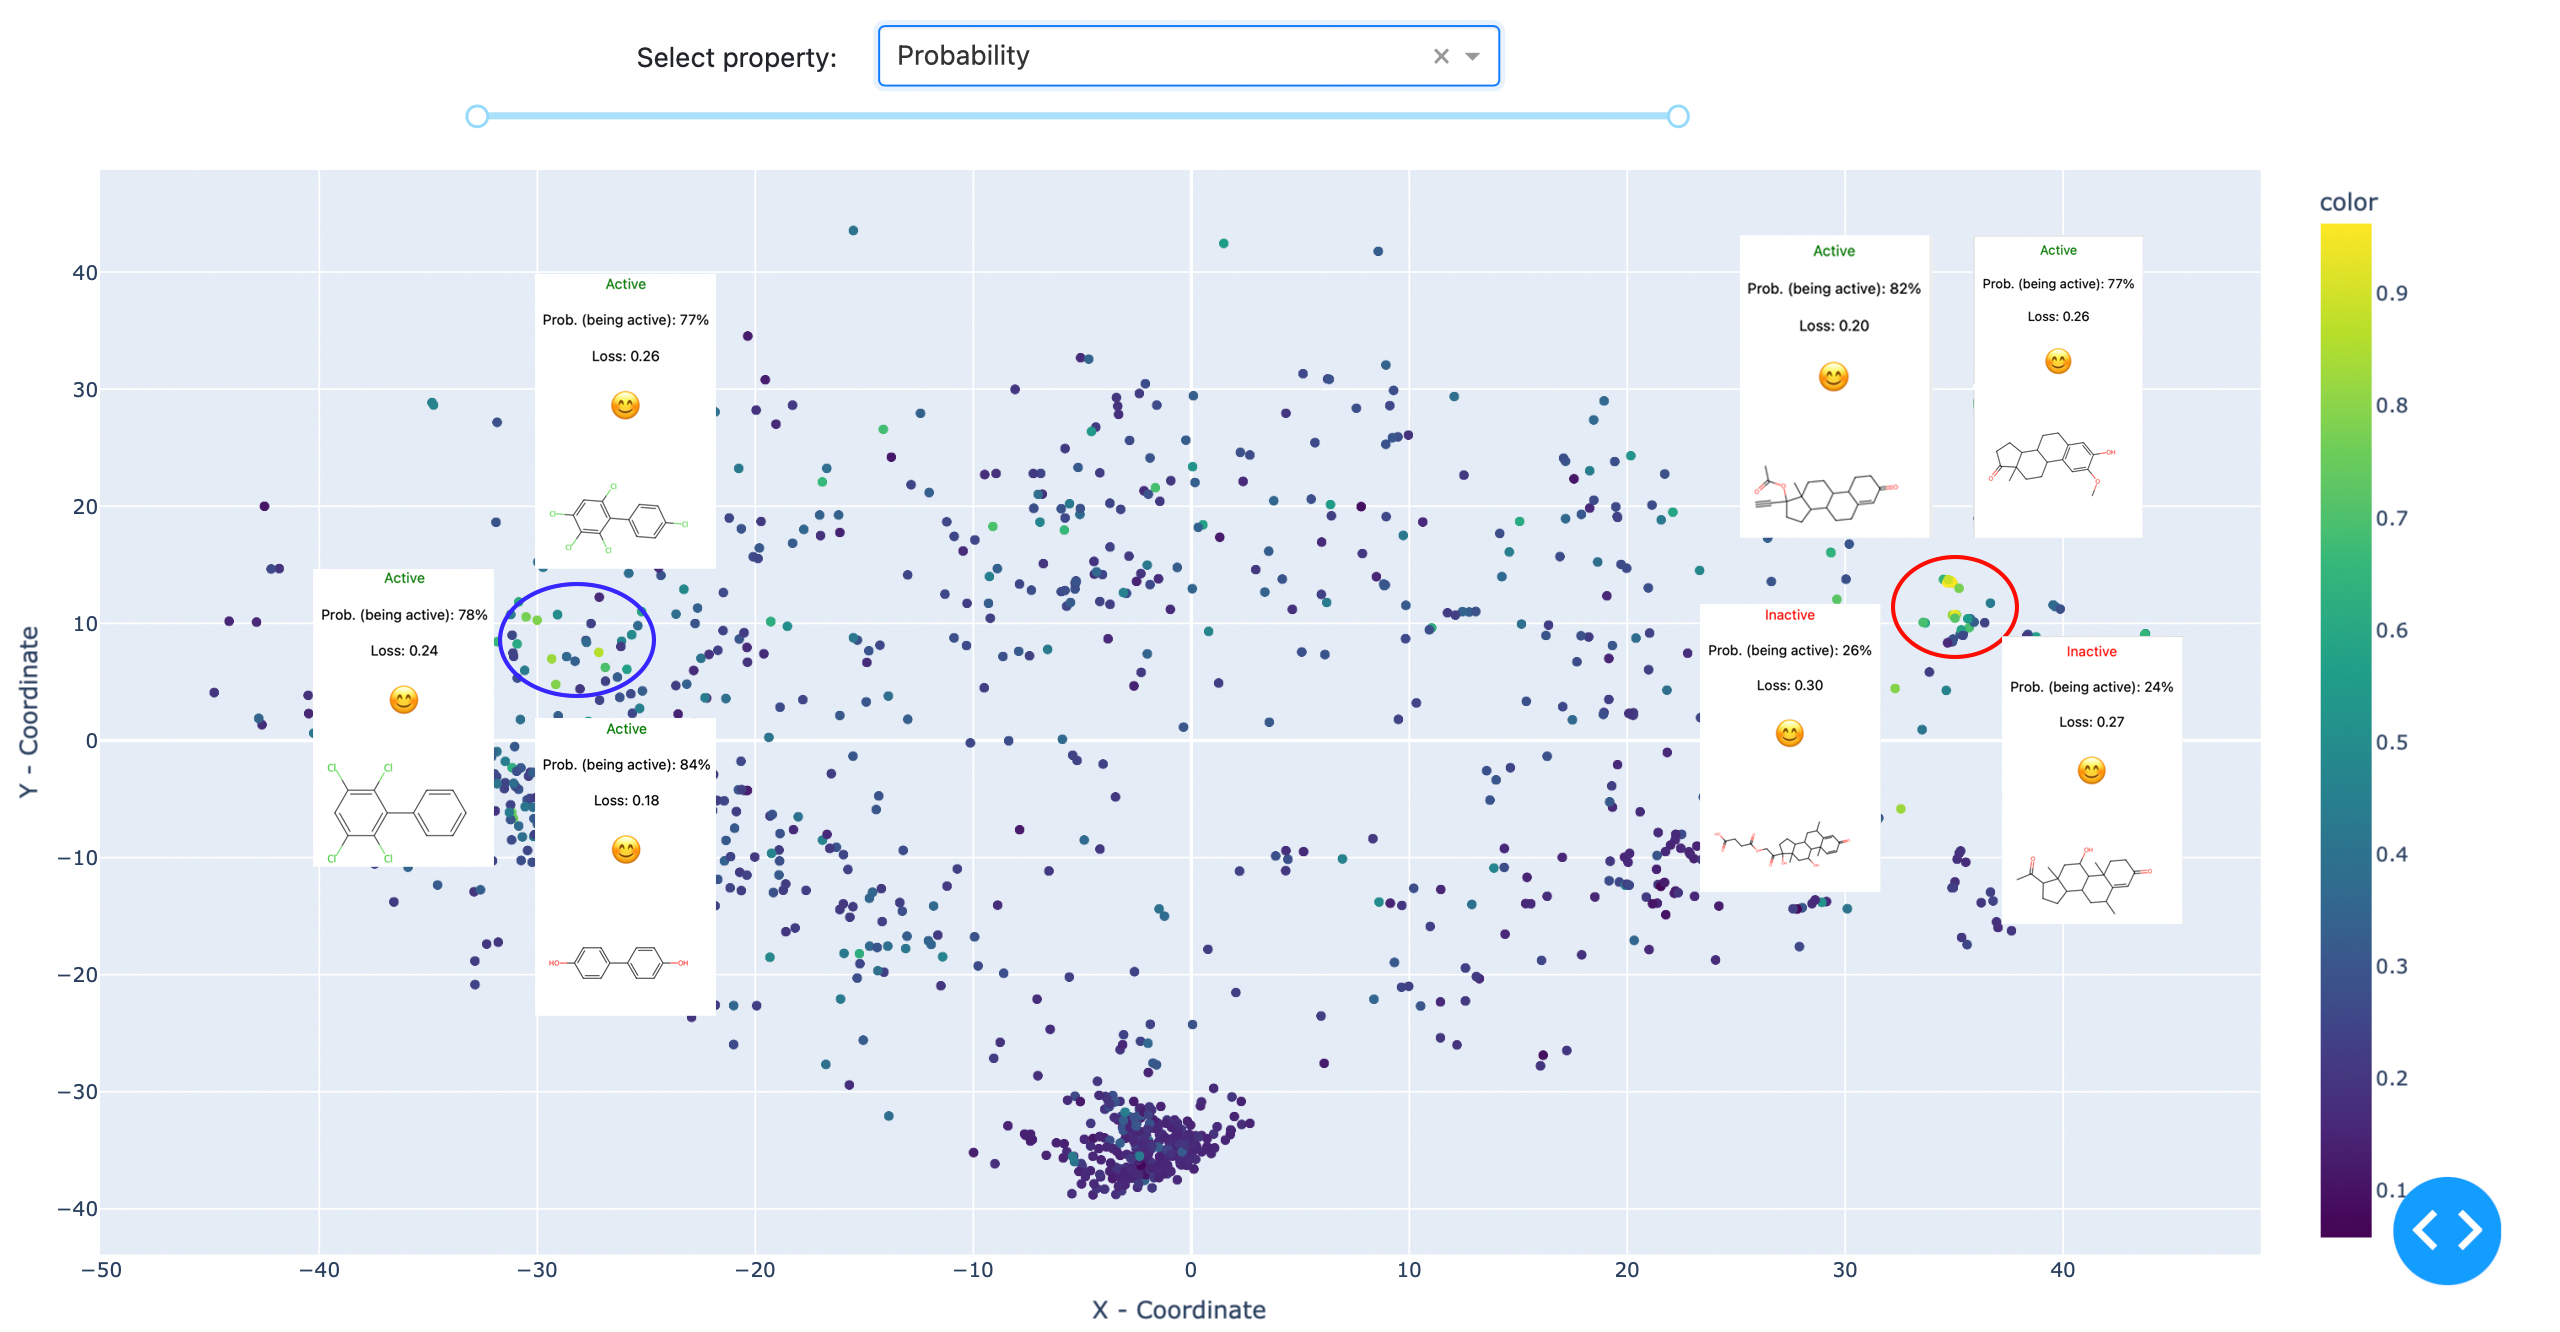
Fig. 3: Two clusters have been attributed with high confidence by the reference model. The denser cluster on the left represents steroid derivatives, while the right, less defined cluster includes polychlorinated biphenyls and polyphenols. The visualised data is: Estrogen Binders dataset. C: Sergey Sosnin
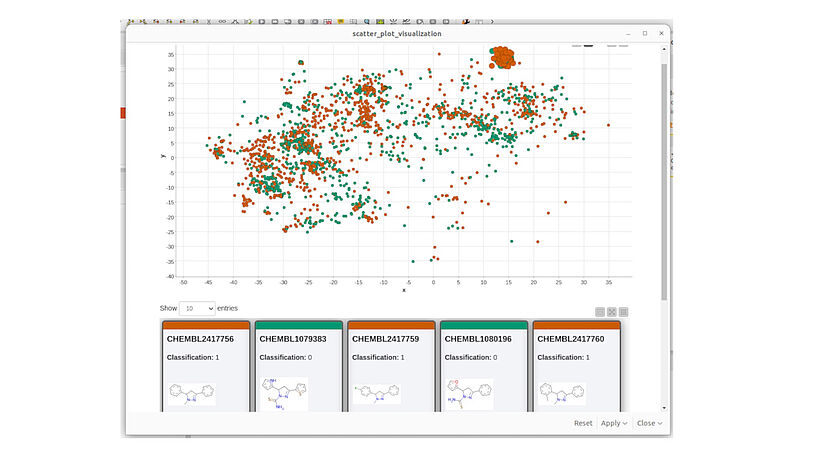
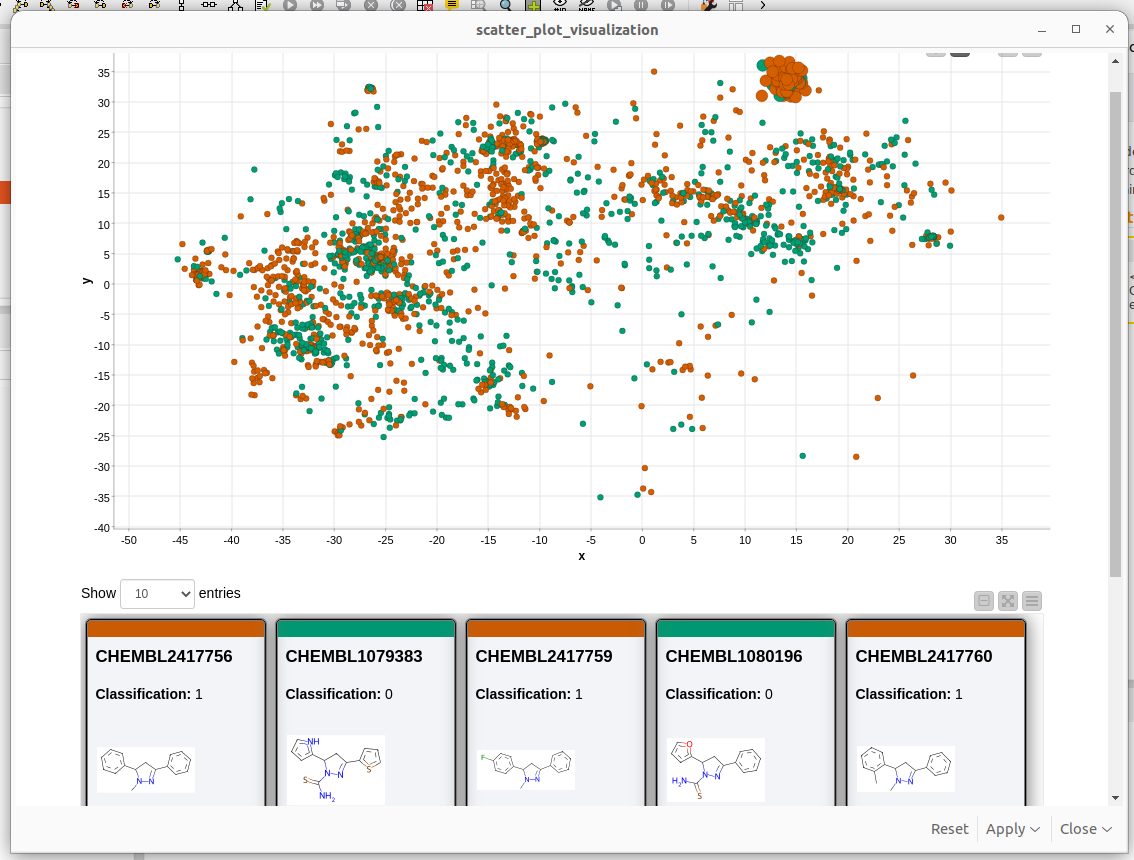
Fig. 4: A screenshot of the KNIME visualization of chemical space using MolCompass KNIME node. C: Sergey Sosnin
Scientists Develop Smart Software Tool for Chemical Risk Evaluation
In recent years, machine learning models have become increasingly popular for risk assessment of chemical compounds. However, they are often considered 'black boxes' due to their lack of transparency, leading to scepticism among toxicologists and regulatory authorities. To increase confidence in these models, researchers at the University of Vienna proposed to carefully identify the areas of chemical space where these models are weak. They developed an innovative software tool ('MolCompass') for this purpose and the results of this research approach have just been published in the prestigious Journal of Cheminformatics.
Over the years, new pharmaceuticals and cosmetics have been tested on animals. These tests are expensive, raise ethical concerns, and often fail to accurately predict human reactions. Recently, the European Union supported the RISK-HUNT3R project to develop the next generation of non-animal risk assessment methods. The University of Vienna is a member of the project consortium. Computational methods now allow the toxicological and environmental risks of new chemicals to be assessed entirely by computer, without the need to synthesize the chemical compounds. But one question remains: How confident are these computer models?
It's all about reliable prediction
To address this issue, Sergey Sosnin, a senior scientist of the Pharmacoinformatics Research Group at the University of Vienna, focused on binary classification. In this context, a machine learning model provides a probability score from 0% to 100%, indicating whether a chemical compound is active or not (e.g., toxic or non-toxic, bioaccumulative or non-bioaccumulative, a binder or non-binder to a specific human protein). This probability reflects the confidence of the model in its prediction. Ideally, the model should be confident only in its correct predictions. If the model is uncertain, giving a confidence score around 51%, these predictions can be disregarded in favor of alternative methods. A challenge arises, however, when the model is fully confident in incorrect predictions.
"This is the real nightmare scenario for a computational toxicologist," says Sergey Sosnin. "If a model predicts that a compound is non-toxic with 99% confidence, but the compound is actually toxic, there is no way to know that something was wrong." The only solution is to identify areas of ‘chemical space‘ – encompassing possible classes of organic compounds – where the model has ‘blind spots’ in advance and avoid them. To do this, a researcher evaluating the model must check the predicted results for thousands of chemical compounds one by one – a tedious and error-prone task.
Overcoming this significant hurdle
"To assist these researchers," Sosnin continues, "we developed interactive graphical tools that display chemical compounds onto a 2D plane, like geographical maps. Using colors, we highlight the compounds that were predicted incorrectly with high confidence, allowing users to identify them as clusters of red dots. The map is interactive, enabling users to investigate the chemical space and explore regions of concern."
The methodology was proven using an estrogen receptor binding model. After visual analysis of the chemical space, it became clear that the model works well for e.g. steroids and polychlorinated biphenyls, but fails completely for small non-cyclic compounds and should not be used for them.
The software developed in this project is freely available to the community on GitHub. Sergey Sosnin hopes that MolCompass will lead chemists and toxicologists to a better understanding of the limitations of computational models. This study is a step toward a future where animal testing is no longer necessary and the only workplace for a toxicologist is a computer desk.
Original publication:
S. Sosnin: MolCompass: multi-tool for the navigation in chemical space and visual validation of QSAR/ QSPR models. Journal of Cheminformatics.
DOI: 10.1186/s13321-024-00888-z
Fig. 1: The demonstration of MolCompass illustrates how a computational toxicologist can identify concerning areas of chemical space. Using our software, the toxicologist can pinpoint regions where the model under investigation incorrectly predicts activity with high confidence. C: Sergey Sosnin
Fig. 2: An illustration of hunting for model cliffs. On the left side of the chemical map, two points lie in close proximity yet display contrasting colors. Further investigation into this peculiar observation uncovers that although these two compounds share a high degree of structural similarity, they exhibit opposite activities, posing a challenge that the model fails to address effectively. The visualised data is: Estrogen Binders dataset. C: Sergey Sosnin
Fig. 3: Two clusters have been attributed with high confidence by the reference model. The denser cluster on the left represents steroid derivatives, while the right, less defined cluster includes polychlorinated biphenyls and polyphenols. The visualised data is: Estrogen Binders dataset. C: Sergey Sosnin
Fig. 4: A screenshot of the KNIME visualization of chemical space using MolCompass KNIME node. C: Sergey Sosnin
Scientific contact
Sergey Sosnin, PhD
Department für Pharmazeutische WissenschaftenUniversität Wien
1090 - Wien, Josef-Holaubek-Platz
+43 1427755111
+49 1627541704
sergey.sosnin@univie.ac.at
Further inquiry
Theresa Bittermann
Media Relations, Universität Wien1010 - Wien, Universitätsring 1
+43-1-4277-17541
theresa.bittermann@univie.ac.at
Downloads:
20240820_Sosnin_Abb1_01.jpg
File size: 242,38 KB
20240820_Sosnin_Abb2_01.jpg
File size: 927,49 KB
20240820_Sosnin_Abb3_01.jpg
File size: 1,81 MB
20240820_Sosnin_Abb4_01.jpg
File size: 547,22 KB